Beyond the Ticker: The Multidimensional Diagnostic Framework Elite Crypto Traders Use to Assess Asset Vitality

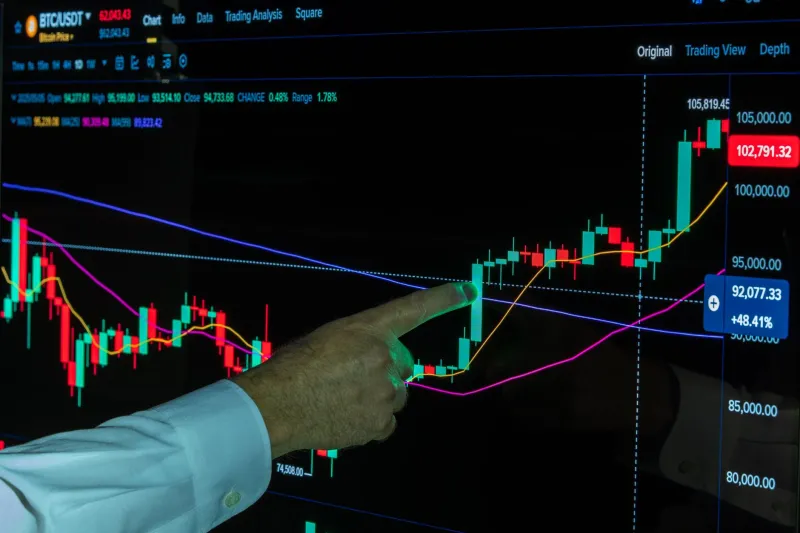
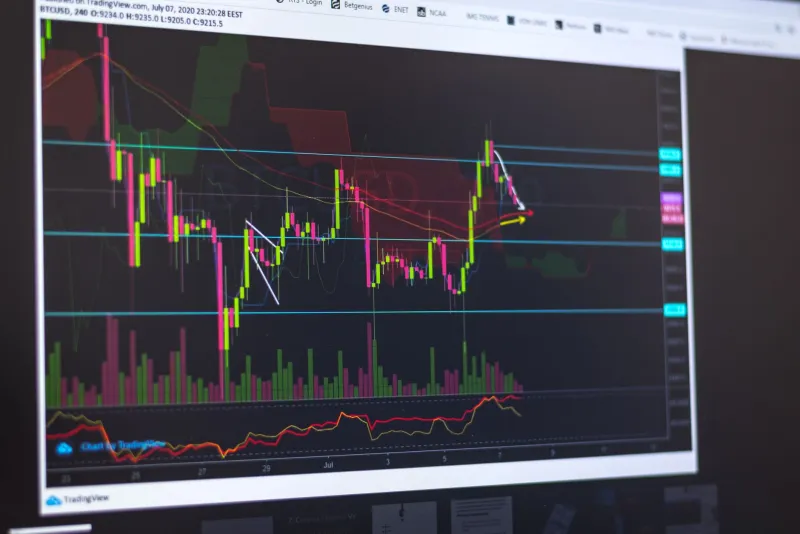
In cryptocurrency markets, price is a lagging indicator. By the time a significant move appears on a standard chart, the underlying conditions that generated it have often been developing for weeks—sometimes months. For traders who rely exclusively on price action, this means perpetually arriving late to the thesis. For those who understand how to read the deeper architecture of a blockchain network, however, the signals emerge far earlier.
At ChainPulse 99, we consistently emphasize that real-time crypto intelligence is not synonymous with real-time price feeds. Genuine intelligence means understanding the full biological anatomy of a digital asset—its circulatory health, its developmental trajectory, and the behavioral patterns of those moving capital through its ecosystem. What follows is a structured framework for conducting that kind of comprehensive assessment.
Why Price Charts Are Insufficient for Serious Analysis
Price reflects consensus sentiment at a given moment. It aggregates the decisions of millions of participants, many of whom are reacting to news, social media narratives, or short-term momentum signals. This makes price data inherently reactive rather than predictive.
The traders and institutions that consistently outperform in crypto markets are not reading the same charts as everyone else—or rather, they are reading charts as one data layer among many. They are cross-referencing price behavior against network utilization, capital flow patterns, and the pace of protocol development. When these deeper signals align or diverge from price, they create the informational edge that separates speculative guessing from structured conviction.
Network Activity Velocity: The Circulatory System of a Blockchain
One of the most revealing diagnostic metrics available to any trader is network activity velocity—a composite view of how actively and efficiently value is moving through a blockchain. This goes beyond raw transaction counts, which can be inflated or suppressed by a variety of technical factors.
Key components include:
- Daily Active Addresses (DAA): A rising trend in unique addresses interacting with the network suggests organic user growth rather than speculative price chasing. Sustained DAA expansion over multiple weeks is a meaningful sign of adoption momentum.
- Transaction Value Transferred: Normalized against circulating supply, this metric reveals whether large or small holders are driving activity. Disproportionate large-value movements may indicate institutional repositioning.
- Network Value to Transactions (NVT) Ratio: Often described as the price-to-earnings ratio of crypto, NVT compares market capitalization to on-chain transaction volume. An elevated NVT suggests the asset may be overvalued relative to its actual utility; a compressed NVT can indicate undervaluation.
A network showing declining active addresses alongside rising prices is a classic divergence signal—one that has historically preceded significant corrections in multiple major assets.
Exchange Flow Dynamics: Reading the Capital Tide
The movement of tokens between private wallets and centralized exchanges provides a real-time window into market psychology. Exchange flow analysis has become one of the most widely utilized institutional tools in the professional crypto analyst's repertoire.
Exchange Inflows represent tokens moving onto trading platforms. Elevated inflows—particularly from long-dormant wallets—often indicate that holders are preparing to sell. When inflows spike against a backdrop of flat or declining prices, selling pressure may be building beneath the surface.
Exchange Outflows, conversely, suggest tokens are being withdrawn to cold storage or private custody. Sustained outflow trends reduce the liquid supply available on exchanges, which can create upward price pressure as demand encounters constrained supply. This dynamic has been particularly observable in Bitcoin markets during accumulation phases.
Stablecoin Reserves on Exchanges add another dimension. A growing pool of stablecoins sitting on exchanges represents dry powder—capital positioned to deploy into the market. When stablecoin reserves rise alongside declining crypto prices, it can indicate that sophisticated buyers are accumulating liquidity in anticipation of entries.
Monitoring these flows across multiple major exchanges simultaneously provides a more complete picture than any single platform's data alone.
Developer Momentum: The Engine Underneath the Hood
No assessment of cryptocurrency health is complete without evaluating the pace and quality of protocol development. An asset with strong price performance but stagnant development is operating on borrowed time; conversely, a project with accelerating development activity but lagging price recognition may represent an asymmetric opportunity.
GitHub commit frequency is the most accessible proxy for development momentum, though it requires contextual interpretation. Raw commit volume can be gamed or inflated with trivial changes. More meaningful signals include:
- New contributor growth: An expanding developer community suggests the protocol is attracting talent, which correlates with long-term ecosystem viability.
- Testnet and mainnet upgrade cadence: Regular, meaningful protocol upgrades indicate an active roadmap and functional governance.
- Documentation and tooling improvements: These often precede application-layer growth, as better developer tooling lowers the barrier for builders to deploy on a network.
For U.S.-based traders evaluating assets with institutional potential, developer activity is particularly relevant. Institutional allocation frameworks increasingly incorporate ecosystem health as a fundamental criterion, meaning development momentum can directly influence future capital inflows.
Constructing Your Own Health Assessment Protocol
The practical application of this framework requires consistent data sourcing and a structured review cadence. The following approach provides a starting point:
- Establish a baseline: Before monitoring changes, document current values for DAA, NVT ratio, exchange inflows/outflows, and GitHub commit frequency for each asset in your portfolio or watchlist.
- Set directional thresholds: Define what constitutes a meaningful deviation from baseline for each metric. Arbitrary precision is less important than consistency—the goal is to detect trends, not to pinpoint exact turning points.
- Review on a weekly cadence: Daily fluctuations in on-chain data can be noisy. Weekly aggregation smooths the signal and reveals more durable directional trends.
- Cross-reference with price: When on-chain metrics diverge significantly from price behavior—either confirming or contradicting the trend—treat that divergence as a research trigger requiring deeper investigation.
- Maintain a log: Documenting your assessments over time builds a personal database of pattern recognition that improves analytical judgment with each market cycle.
The Institutional Edge Is Informational, Not Intuitive
A persistent misconception among retail participants is that professional traders succeed because of superior intuition or access to exclusive information. In practice, the edge is largely methodological. Institutions apply structured, repeatable analytical frameworks to a broader set of data inputs than most individual traders consider.
The metrics described here are not proprietary. Most are freely accessible through on-chain analytics platforms, block explorers, and open-source code repositories. The advantage lies not in the data itself, but in the discipline of integrating it systematically into a trading decision process.
For traders serious about elevating their analytical practice, the transition from price-chart dependence to multidimensional health assessment is less a technical challenge than a behavioral one. It requires committing to a more deliberate, research-intensive approach to market participation—one that treats every asset as a living system with measurable vital signs rather than a ticker symbol responding to headlines.
The pulse of a cryptocurrency is always broadcasting. The question is whether you are equipped to listen.